WDOTIS: wearable optical sensing
Testing an inherited optical platform, diagnosing acquisition timing, and establishing what its measurements can support.
The wearable platform
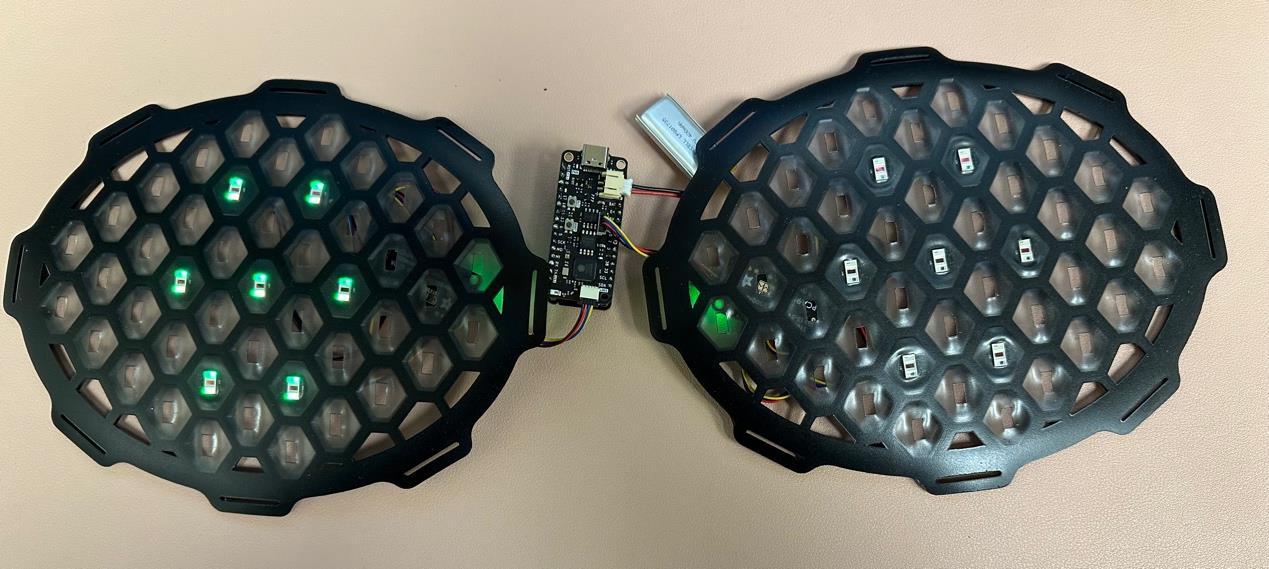
Validation before reconstruction
WDOTIS is a wearable diffuse optical tomography research project at the Columbia Laboratory for Unconventional Electronics, in collaboration with FIT and VEIL Intimates. Its intended application is breast-health monitoring. My work focuses on validating the optical acquisition needed before an imaging result can be trusted.
I inherited the hardware design and developed the firmware and analysis code. The current platform uses a FeatherS3 in place of the earlier STM32 controller.
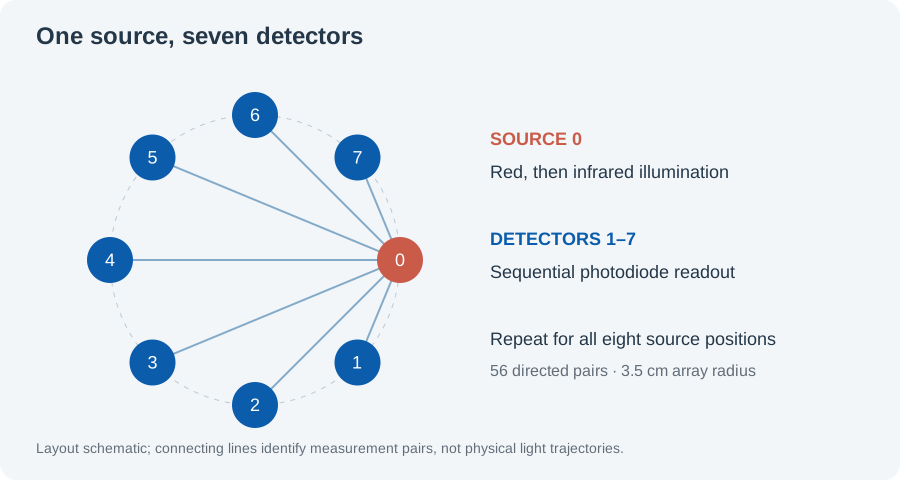
Eight sensors arranged on a 3.5 cm radius circle provide 56 directed cross-sensor pairs. Each measurement uses one source and the other seven sensors as detectors.
Checking the sensor response
The June progress report documents a four-case check against black plastic: all LEDs off, then green, red, and infrared illumination. I recorded each module’s dark offset and wavelength response before investigating cross-sensor acquisition.
Dark baselines differed between modules. The phantom comparison also showed session-to-session baseline differences, making a consistent reference essential before interpreting signal ratios.
Finding the timing limitation
Pulsed illumination produced intermittent cross-sensor detection. I investigated a timing mismatch between independently clocked AFE4404 devices. This diagnosis comes from acquisition behavior rather than a direct clock measurement.
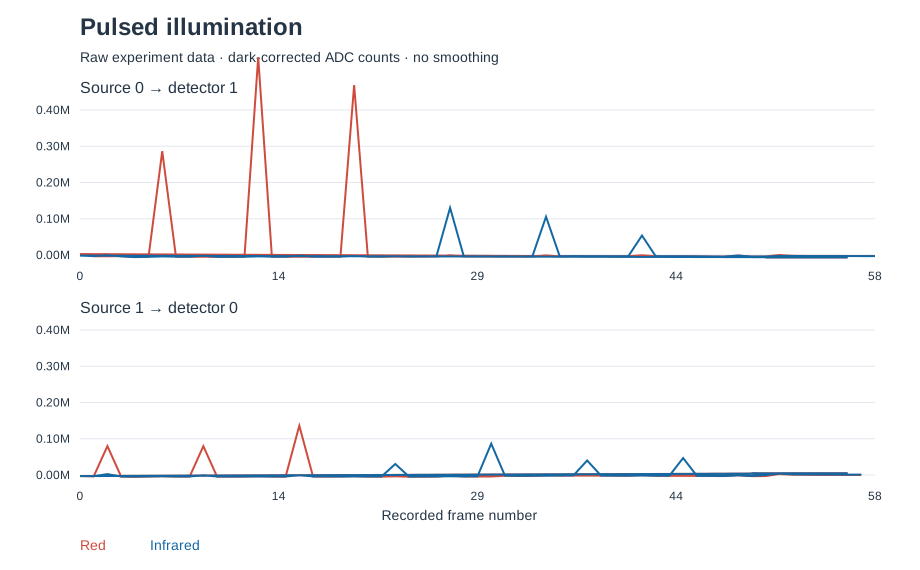
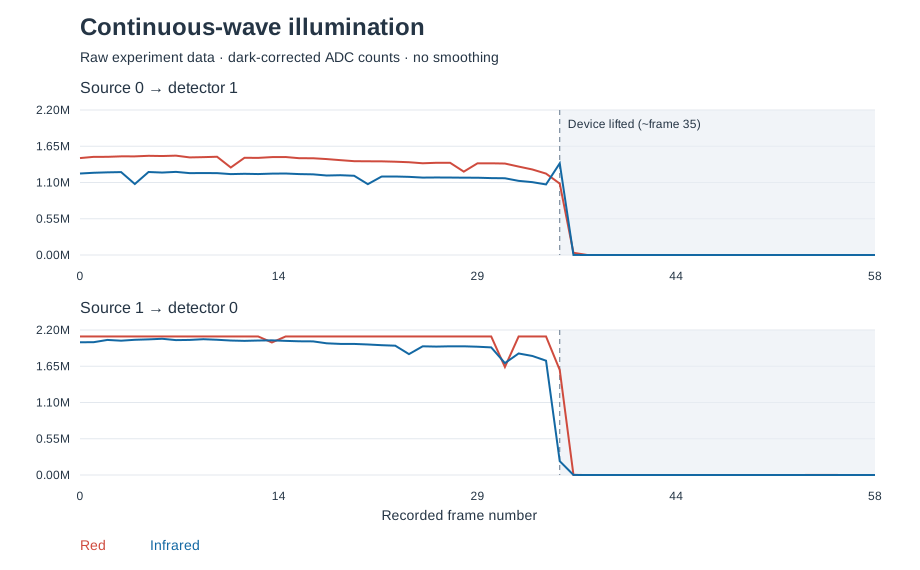
Widening the source LED on-window to effectively continuous emission bypassed dependence on relative clock phase. Shortening the timing period and attempting faster round-robin reads did not produce usable results and were reverted.
A shared external clock with a broadcast timer reset was proposed but never tested on hardware: the existing module does not expose the AFE4404 clock pin.
Phantom comparison
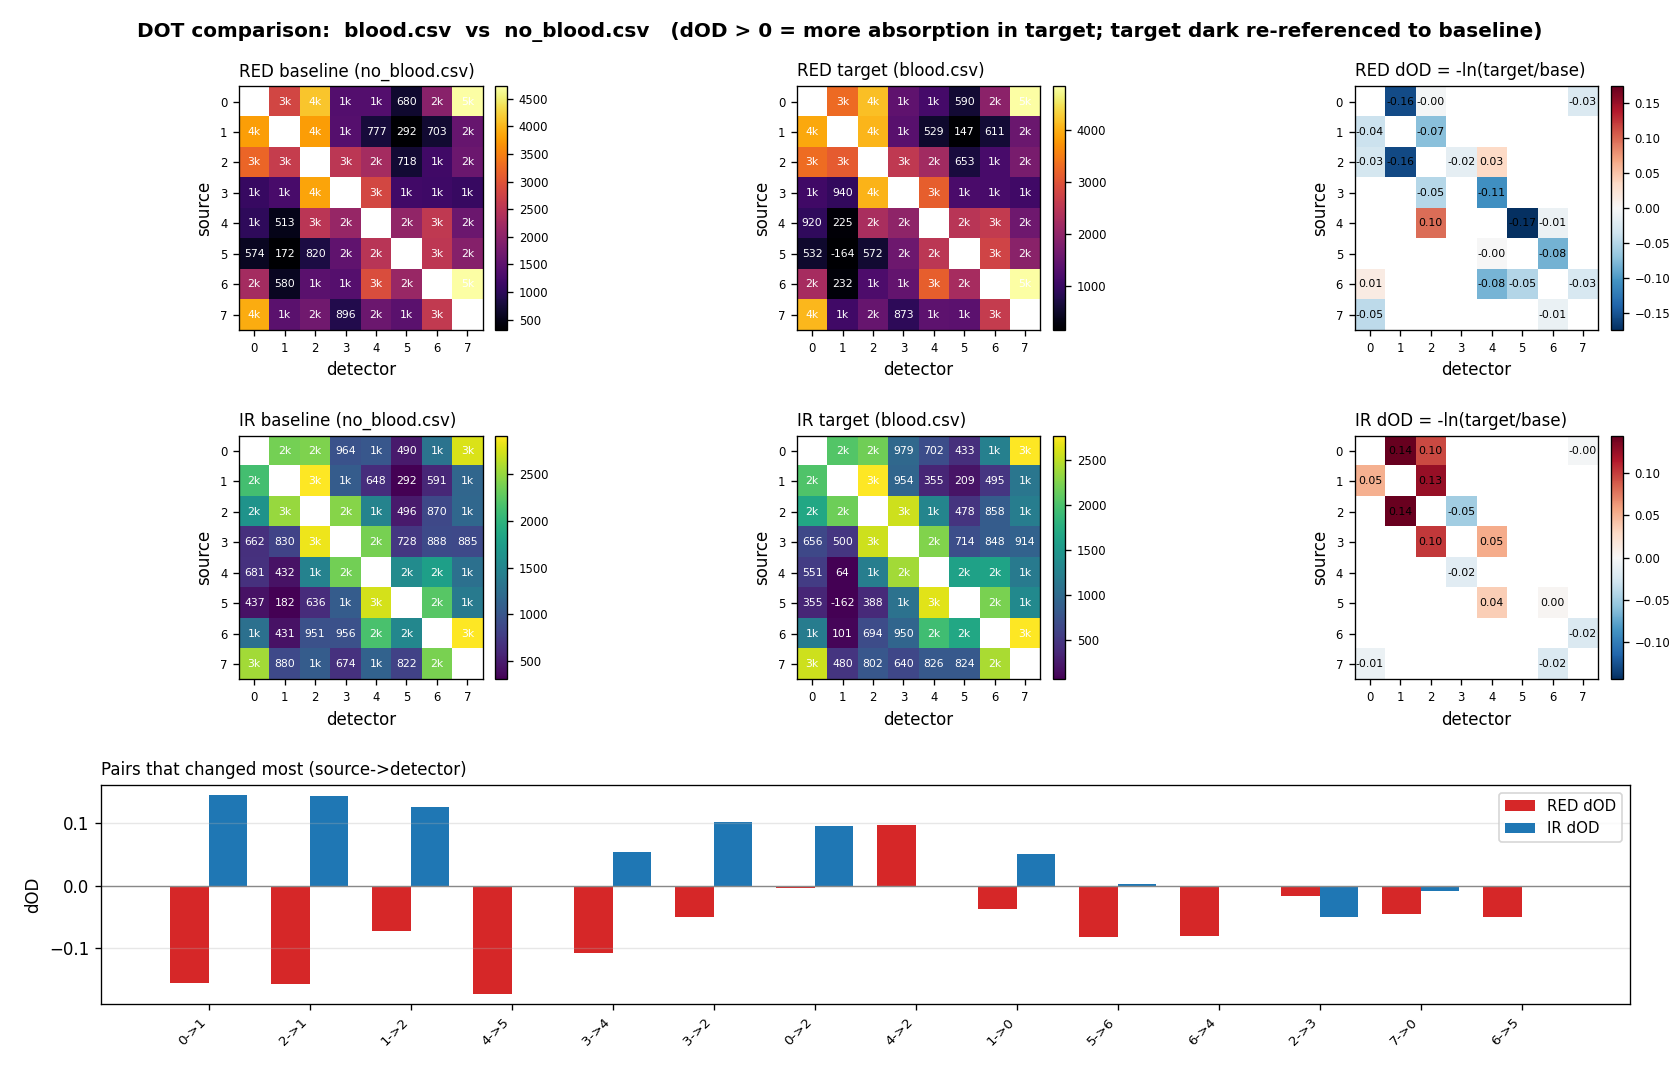
I measured the same silicone phantom with its embedded tube empty and then filled with red-pigmented blood mimic. The recordings use continuous-wave firmware. These are optical comparisons with a blood mimic, not measurements of real blood or validated physiological biomarkers.
Contact changes the measurement
In the April experiment, source module 6 alternated red and infrared illumination while the other modules were read. A fingertip covered source 6 and neighboring module 5. The presentation compares relaxed and pressed contact.


Finger PPG
With a fingertip placed over the LED, I completed a pulse test using relative photodiode readings and signal-event intervals to infer heart rate. The firmware includes an adaptive threshold and interval-based estimate. This is a functional demonstration; no reference-device accuracy result is claimed.
Phantom design and reconstruction
An earlier design study considered a layered phantom with absorbing and scattering additives and an embedded vascular channel. The reported empty-versus-filled experiment used the same silicone phantom, as described above; the proposed layered recipe is a separate design exploration.
The software pipeline forms changes in optical density, builds a sensitivity matrix, and uses regularized inversion before exploratory chromophore separation. The June report identifies inconsistent baselines and signal ratios as limitations. It does not establish total-hemoglobin or oxygen-saturation measurements.
Current status
Project documentation
Based on my April WDOTIS experiment update, June 18 progress report, and phantom-design study, with project status updated in September 2026. Literature benchmarks and proposed experiments in those slides are not presented as results of this prototype.